Thursday, June 11, 2009

.NET CLR Thread Pool Internals

In the previous post we saw how applications that need to scale up can utilize the Task Parallel Library and the improved CLR 4.0 thread pool in order to optimize the scheduling of their massive amount of fine grained, short living tasks.

In this post we’ll dive through the implementation of the CLR thread pool in an attempt to understand the way in which it optimizes the creation and destruction of threads in order to execute asynchronous callbacks in a scalable fashion.

CLR Thread Pool v.s Win32 Thread Pool

The CLR thread pool is the managed equivalent of win32 thread pool (that is available since Windows 2000). Although they expose different APIs and differ in design, implementation and internal structure – the basic operation manner remained the same. Application code queue callbacks that the thread pool execute asynchronously in a scalable fashion through heuristic algorithm.

The main advantages of the CLR thread pool are that 1) it includes separate pool for ordinary callbacks (user callback, timers etc) and separate pool for asynchronous I/O (which maintains a process wide I/O completion port).  And 2) it is aware of managed beasts such as the GC, that blocks the application threads during collection which can cause the unaware pool to create redundant threads.

Managed applications should use the CLR thread pool even on top of the Vista thread pool - that exposes richer API and performs a lot better than Win32 legacy pool. Also because the CLR thread pool is already used by many components that are integrated parts of the .NET Framework, such as Sockets,  FileWriter/Reader, System/Threading timers and more.

How does the CLR Thread Pool Work? and Why should We Care?

There’s a lot of truth in the saying that most applications are better of being designed with no respect to the internal operation fashion of the thread pool (since it’s subject to change). However, it’s important for the developers to get familiar with the internals of the thread pool since 1) nobody likes black boxes managing the execution of their code, 2) it might convince some to neglect thoughts about creating a custom thread pool, and 3) wrong utilization of the thread pool can result in starvation (due to too many callbacks running together) or on extreme cases deadlocks (due to callbacks relying on each other to complete).   

So...

Since the main overhead of asynchronous execution is the creation and destruction of threads - a key feature of the thread pool is to optimize the creation and destruction of threads.

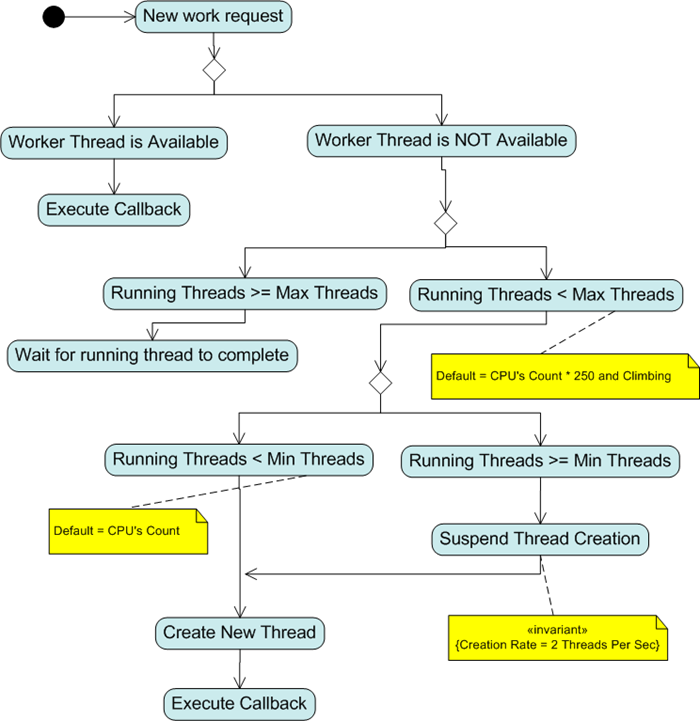
The basic operation manner of the thread pool is actually pretty easy to explain. The thread pool starts from 0 threads, it immediately creates new threads to serve work requests until the number of running threads reaches a configurable minimum (the default minimum is set to the number of CPUs on the machine).

While the number of running threads is equal or bigger than that minimum – the thread pool will create new threads at the rate of 1 thread per 0.5 second. Which means that if your application is running on a dual core machine, and 16 work requests that spans for 10 seconds are scheduled together, assuming the the thread pool is empty, the first two request will be served immediately, the third after 0.5 second, the forth after 1 second and the 16th after 7 seconds. In addition, to avoid unnecessary starvation a demons thread is running in the background and periodically monitors the CPU – in case of low CPU utilization it creates new threads as appropriate.

The thread pool will not create new threads after it reaches a configurable maximum. The default maximum is set to 250 * number of CPUs, which is 1o times more than it was in the 1.0 version of the .NET Framework. The default maximum was increased in order to reduce the chance for possible dead lock that can occur when callbacks rely on each other in order to complete.

After a thread finish its work it is not being destroyed immediately, rather it stays in the pool waiting for another work to arrive. Once new work arrive it is being served immediately by one of the waiting threads. The waiting threads are being destroyed only after spending 10 seconds (was 40 seconds) on the pool doing nothing.

The following figure shows how the ‘thread injection and retirement algorithm’ of the thread pool works.

image

What the Future Holds?

In the 4.0 version of the CLR thread pool - the ‘thread injection and retirement algorithm’ has changed. In cases where there are more running threads than CPUs - instead of creating new threads at the rate of 1 thread per 0.5 second – the new thread pool takes the liberty to ‘hold back’ threads (i.e. reduce the concurrency level) for a while. 

image

In addition, the maximum threads count is NOT being set to some arbitrary number (like 20-250) that is big enough to help preventing dead locks, instead it’s being set to the maximum that the machine can handle in the limitation of the process virtual address space.

Each thread consumes 1M of committed bytes. So applications which allow infinite number of parallel tasks will sooner or later run out of contiguous virtual address space. Thus, the thread pool doesn’t allow the introduction of a new thread that will be the cause of OutOfMemory exception.
Tuesday, June 2, 2009

UML Activity Diagram – Modeling Parallel Applications

Activity diagrams are used to model the behaviors of a system, and the way in which these behaviors are related in an overall flow of the system. In simple terms, they show system-wide and component-wide workflows.

This post introduces an approach for modeling parallel applications by utilizing activity diagrams to show parallel workflows and point out the places at which they get synchronized, and using class diagrams and sequence diagrams to put together the complete parallel puzzle.

Showing parallel workflows via activity diagrams is great in the early stages of the design, where there’s almost no respect to classes and there’s no need to show who does what. However, when entering to the detail stage we’ll often want to see more then the activity diagrams are willing to revile. At this point we’ll need the sequence diagrams and the class diagrams to complete the picture, as we’ll see in the case study further on.

Paralleling Actions

The ‘Fork’ element is used to show that actions execute in parallel. In the figure below, Action1 calls Action2 and Action3 in parallel.

image

Using expansion regions we can show that sequence of actions (activity) may execute concurrently.

image 

Synchronization

If you do parallelism, you'll probably need to synchronize. The ‘Join’ element is used to show that a certain action will not execute until some other actions are done. In the figure below, action 3 will not execute until Action1 and Action2 are done.

image

Case Study – Camera Picture Processing

Let’s see how the activity diagram can be used to model the parallel behavior of a picture processing application. The application supports different kinds of cameras (Bulet, Dome etc), the cameras periodically send picture streams, which the appropriate agent receives and analyzes as appropriate. We will focus on the Dome camera that analyzes the stream in 3 phases.  

The activity diagram below shows that the phases of the analysis run in parallel. The 1st and the 2nd phases run concurrently, while the 3nd phase starts only after the 2nd phase complete, on top of that, only after all 3 phases are done the analysis process complete and the results get published .

image

We need more!

The thing with activity diagrams is that they don’t convey which class is responsible for each action. This is quite alright in the first stages of the design, but as we move forward with the design we also want to see which object initiate the parallel action, which object is synchronized with which, and in some cases we even want to get some information about the thread that initiate the activity, is it a thread-pool thread, is it some background thread that we’ve created to do some periodic work, is it the main thread etc.

Using Activity Diagram with Partitions

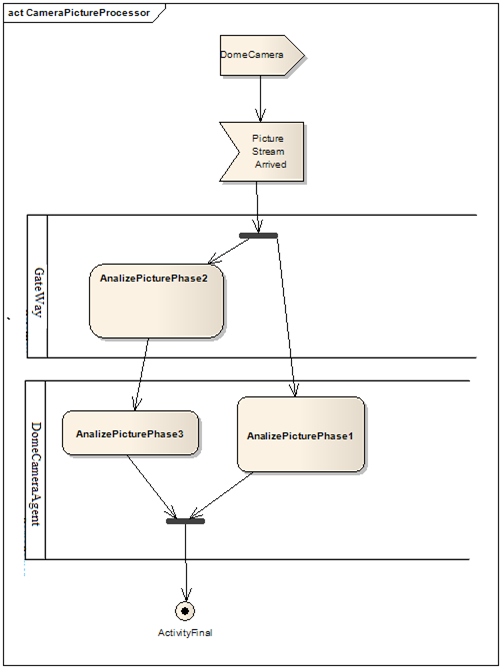
Partition elements can be used to divide the diagram in order to show which action belong to which class.

image

Using Class Diagram

So we get that the Gateway is responsible to the 2nd phase and the DomeCameraAgent is responsible to the 1st and the 3rd, but merely seeing that is not enough. 

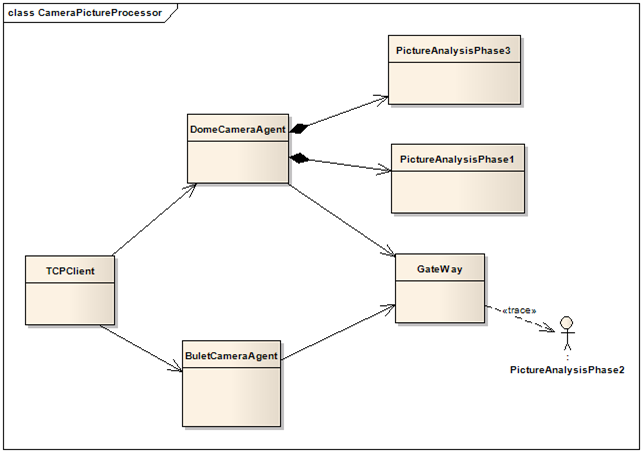
The class diagram below shows that the DomeCameraAgent composes the objects responsible for the 1st and 3rd phases, and that the 2nd phase actually runs in a separate node that is reachable through a gateway that is also used by other cameras.

image

Using Sequence Diagram (High Level Design)

The sequence diagram below is very similar to the activity diagram shown above, but now we see that the entire 3 phase analysis is eligible to run in parallel (as the ‘par’ Operator indicates), which consequently rules that DomeCameraAgent and its parts must be thread-safe, and so does the Gateway (we already suspected that it should after we realized that it is used by other agents). We use timing constraints to show that the overall analysis ends and the results are published only after both 1st and 3rd phases complete.

image

Using Sequence Diagram (Detail Design)

Way to Go Parallel

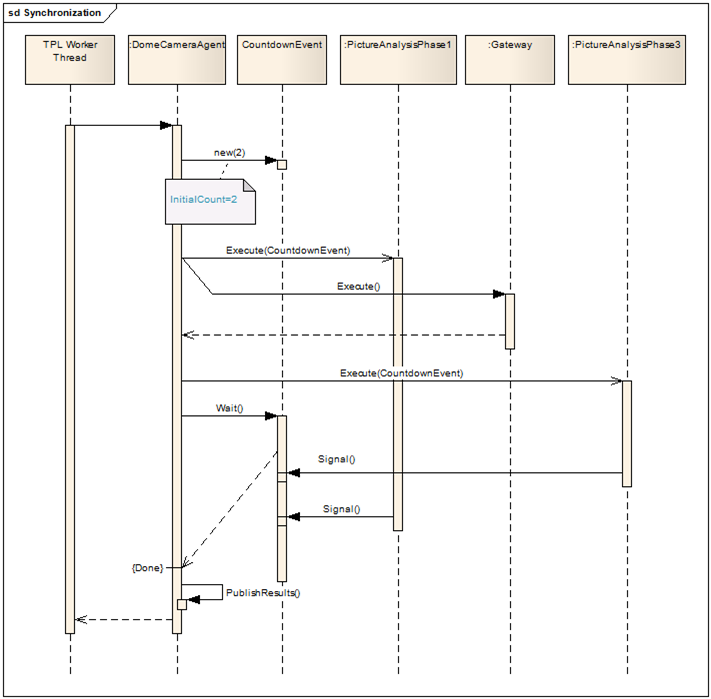
Now let’s get into details, first let’s see how DomeCameraAgent makes things go parallel.

image

The sequence above shows that we choose to scale up via Task Parallel Library (TPL). At some early point, DomeCameraAgent creates custom scheduler with the appropriate concurrency level and priority. When picture stream arrives - TCPClient calls ‘RunAnalysis’ on the DomeCameraAgent, the latter schedule the analysis callback via TPL instructing it to use the custom scheduler. In turn, TPL execute the callback in a scalable fashion. Setting the concurrency level to say…3 and setting the priority to Low- will yield up to 3 analyses running in parallel in low priority. This may or may not make sense, but at least now we can present the design and get some feedback.

Way to Synchronize

The 1st act of synchronization is to make sure the 3rd phase will run only after the 2nd, this is easy, we simply run the 2nd  phase synchronously from the context of the worker thread, when it is done, we go a head and run the 3rd phase. The second act is to wait for the 1st and the 3rd phases, this requires some actual synchronization, we use the CountdownEvent class (new to .NET Framework 4.0) that is signaled when its count reaches zero,  we set its initial count to 2, execute the analysis phases and wait for the event to signal. When the 1st phase complete it signals the event therefore decrementing its count, and the same goes for the 3st phase. No matter which phase completed first, or even if the 1st phase had managed to signal before the wait began– the event will be released from the wait only after both (thus all) phases are done.

image

UML Sequence Diagram: Interaction Fragment (Alt, Opt, Par, Loop, Region)

A common issue with sequence diagrams is how to show conditions and iterations. Indeed, the activity diagram is more appropriate to model control logic that involves conditions, loop etc, but in practice, most developers prefer to stick with the sequence diagram to show how objects interact together with the control logic involved.  

Using Notations

A simple way of presenting conditions and loops is using simple notes. The sequence bellow shows CarsManager that iterate though collection of Cars and execute a wash on each Car, which in turn delegate to the appropriate strategy according to the requested technique.

image

Using Interaction Frames (Combined Fragment)

Another way of presenting control logic is using fragments (a.k.a interaction frames) together with Interaction Operators.

With fragments we can delimit set of calls to show that they 1) execute only if a given condition is true 2) execute in a loop 3) run in parallel 4) reside within a critical section 5)etc. The latter calls can be partitioned to groups (combined fragment) to show according to which condition each group will execute.

Interaction Operators (shown below) are used to characterize the fragment. For instance, in order to define that a call will execute only if a certain condition is true – we delimit the call with a fragment and use the operator ‘Opt’ to specify the condition. 

The following table provides guidance on the most useful operators, and their corresponding descriptions.

alt

Divides fragment into groups and defines condition for each group -  only the one whose condition is true will execute .

opt

Defines condition to a single call - the call will execute only if the supplied condition is true . Equivalent to an alt with only one trace.

par

Defines that the calls within the fragment run in parallel.

loop

Defines that the calls within the fragment run in a loop.

region

Defines that the calls within the fragment reside in a critical section, i.e. the fragment can have only one thread executing it at once.


 image


Links

http://resource.visual-paradigm.com/uml_diagrams/sequence_diagram/sequence_diagram_notation.html